How to browse proteomaps
Back to main page
What do the proteomaps show?
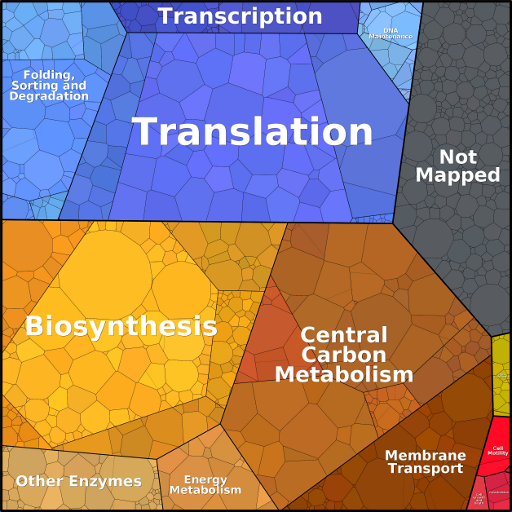
All maps show measured protein abundances, weighted by protein chain lengths. Links in the top line take you to the four hierarchy levels (level 1, 2, 3, and the protein level).
Each protein or protein category occupies a
certain area, i.e. a certain mass-certain fraction of the total
proteome. To see the numerical values, move the mouse pointer over
a region of interest: after a short while, the value will be
visible. The mass abundance (measured abundance times protein
chain length) is given as a percentage value. Currently, this
feature is only available in some of the proteomaps.
The estimated copy (molecule) number is obtained by scaling the
measured abundances to the total protein number per cell. We note
that growth conditions can change cell volume several fold and thus
affect the copy numbers accordingly. We use a generic value of ~3
million proteins per micron cubed of cell volume (Milo, Bioessays 2013) and characteristic reported
cell volumes. This leads us to the following total protein number per
cell type:
| Mycoplasma pneumoniae | 5 * 104 molecules/cell |
| Escherichia coli | 3 * 106 molecules/cell |
| Saccharomyces cerevisiae | 1 * 108 molecules/cell |
| Schizosaccharomyces pombe | 3 * 108 molecules/cell |
| Arabidopsis thaliana | 1 * 1010 molecules/cell |
| Mus musculus | 1 * 1010 molecules/cell |
| Homo sapiens | 1 * 1010 molecules/cell |
Information in the protein-level maps
In the protein-level maps, systematic gene names or Uniprot IDs (as used inthe original proteome data) are shown in brackets, and most proteins are linked to pages from the KEGG database, showing detailed information about the protein. Click on a tile to access the corresponding page.
How to use the zoom
The "Zoom" version of the protein map has no links, but allows you to zoom in and out easily (using mouse wheel or page up/down keys) and to move within the map (using the cursor keys).