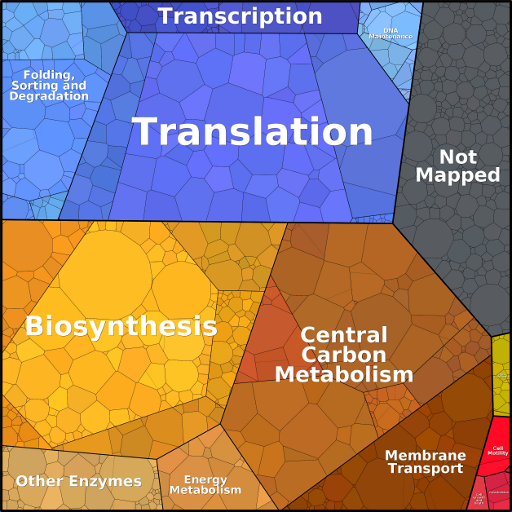
How are proteomaps generated?

Back to main page
Proteome tree maps visualization
To generate proteomaps, we modified the algorithm for the construction of Voronoi treemaps described in bernhardt et al. (2009) to present polygons with variable sizes. The algorithm was implemented in the Paver software (DECODON (Greifswald, Germany)). Example maps can be browsed interactively; individual protein tiles are linked to protein information on the KEGG website.
In the proteomaps shown here, we visualize three levels of functional categories and a level of individual proteins. To create a proteomap, a total area is first divided into polygons representing the top-level categories. These polygons are constructed from a Voronoi diagram, where the polygons' areas were chosen to represent copy numbers weighted by protein chain lengths (the investment in terms of amino acids, also termed the mass fraction). The top-level areas are then subdivided into subcategories and the procedure is repeated down to the level of individual proteins. When several orthologous proteins exist in the same proteome, e.g. isozymes such as the two enolases Eno1 and Eno2 in yeast glycolysis, they share one subdivided polygon.
Proteins that do not have a functional category annotation are lumped in a subclass labeled "Not mapped". Mass fractions smaller than 1/1,500,000 of the whole proteome (corresponding to 4 pixels within an area of 2500 x 2500 pixels in size) are excluded. The arrangement of categories and proteins over the area is kept as consistent as possible between proteomaps. To ensure a similar layout across datasets, a template proteomap can be used to initialize proteomaps for other data sets at the highest hierarchy level. However, due to differences in protein abundances, congruent arrangements cannot always be fully achieved. Colors are used for association within functional categories and have no quantitative meaning. Specifically, small variations in color are used to differentiate among detailed functional categories within the same broad functional category, e.g. shades of blue within "Genetic Information Processing".
See comparison to pie or bar plots
Protein abundance data sources and gene mapping
Protein data were taken from the original publications and from the proteome database PaxDb. Criteria for choosing data sets to be included were: a high proteome coverage; quantitative values that are proportional to abundance, ideally reported as absolute numbers; and refraining from biases such as mixed cell types or a known strong misrepresentation of cellular compartments or functions. All proteomes had been quantified by mass spectrometry, except for the data from Newman et al. (2006) which were quantified by fluorescence of GFP-tagged proteins. To assign proteins to functional categories, systematic gene names (ORF names) were annotated with KEGG Orthology identifiers. Protein chain lengths were obtained from Uniprot. Proteins of unknown length, due to mapping issues, were assigned a standard length of 350 amino acids.
Protein functional hierarchy and category assignment
KEGG pathway maps were chosen as a basis for our functional gene hierarchy because of their clearly layered structure, which shows protein functions in different categories on a comparable degree of resolution. Proteins are assigned to functions via Kegg Orthology (KO) IDs, which makes them comparable between organisms.
The same protein can be assigned to multiple functional categories. Voronoi Treemaps, in contrast, require a tree-like hierarchy. To assign each KO ID to a single bottom-level category, we had to define a default priority order between the functional categories, in which, for instance, assignments to "Transcription" would override assignments to "Metabolism". The default choice can be overridden by manual assignments. Moreover, we found that for consistency with the literature some functional categories had to be added, renamed, or restructured. The customized version of the KEGG hierarchy can be downloaded here.
Since each KO ID appears, on average, in about two pathway categories, our priority order can create a bias towards certain categories. To quantify this bias, we randomized the priority order and computed median values and uncertainty ranges for category areas arising from different possible protein annotations. We find that random reassignments had only little effect on the overall category areas and that none of our qualitative observations change substantially.
The KEGG hierarchy proved useful for the present
purpose, but proteomaps can also be produced with other classification
trees such as TIGRFams, the original KEGG pathway maps, the MIPS
Functional Catalogue, TheSEED, Riley
scheme derived classification systems, and many more. Ontologies such
as the widely used and flexible
See proteomap based on Gene Ontology
References
- Kanehisa, M., Goto, S., Kawashima, S., Okuno, Y., and Hattori, M. (2004). The KEGG resource for deciphering the genome. Nucleic Acids Research 32, D277-280.
- Otto, A., Bernhardt, J., Meyer, H., Schaffer, M., Herbst, F.-A., Siebourg, J., Mäder, U., Lalk, M., Hecker, M., and Becher, D. (2010). Systems-wide temporal proteomic profiling in glucose-starved Bacillus subtilis. Nature Communications 1, 137.
- Bernhardt J, Funke S, Hecker M, Siebourg J (2009). In: Sixth International Symposium on Voronoi Diagrams, pp 233-241.
Citing proteomaps
if you use proteomaps in your work, please cite:
Contact
- Wolfram Liebermeister, INRAE Jouy-en-Josas
- Ron Milo, Weizmann Institute of Science
- Jörg Bernhardt, Universität Greifswald