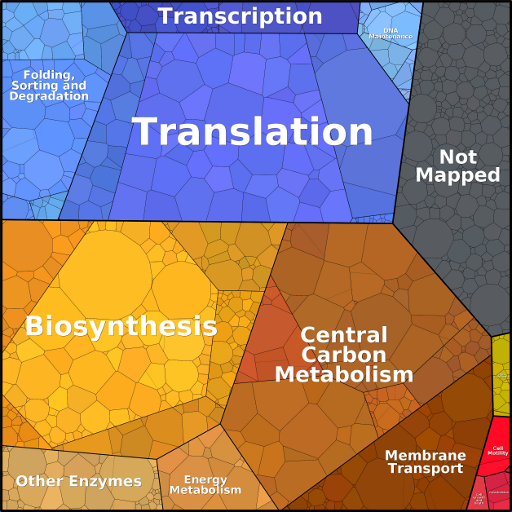
Depicting the protein composition of cells
Proteomaps show the quantitative composition of proteomes with a focus on protein function. They are built automatically from proteome data and based on the KEGG Pathways gene classification. Each protein is shown by a polygon and functionally related proteins are arranged in common regions. To emphasize highly expressed proteins, polygon areas represent protein abundances, weighted by protein size.
Generate proteomaps from your own data
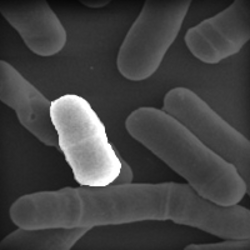
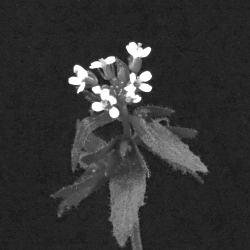
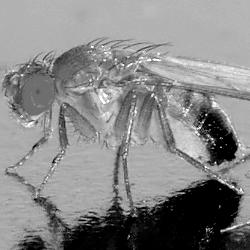
To open one of the proteomaps below, choose an organism by clicking on the picture and click on a proteomap symbol in the list. The line above the proteomap allows you to navigate between hierarchy levels. Hover the mouse pointer over a map to see the abundance values.
|